Ahmed Abdeldjallil DJELLAB
Machine Learning enthusiast
Data Science Master student
View My LinkedIn Profile
Anomaly Detection
import numpy as np
import matplotlib.pyplot as plt
from utils import *

%matplotlib inline
# Load the dataset
X_train, X_val, y_val = load_data()
X_train[2]
array([14.19591481, 15.85318113])
# Display the first five elements of X_train
print("The first 5 elements of X_train are:\n", X_train[:5])
The first 5 elements of X_train are:
 [[13.04681517 14.74115241]
 [13.40852019 13.7632696 ]
 [14.19591481 15.85318113]
 [14.91470077 16.17425987]
 [13.57669961 14.04284944]]
# Display the first five elements of X_val
print("The first 5 elements of X_val are\n", X_val[:5])
The first 5 elements of X_val are
 [[15.79025979 14.9210243 ]
 [13.63961877 15.32995521]
 [14.86589943 16.47386514]
 [13.58467605 13.98930611]
 [13.46404167 15.63533011]]
# Display the first five elements of y_val
print("The first 5 elements of y_val are\n", y_val[:5])
The first 5 elements of y_val are
 [0 0 0 0 0]
print ('The shape of X_train is:', X_train.shape)
print ('The shape of X_val is:', X_val.shape)
print ('The shape of y_val is: ', y_val.shape)
The shape of X_train is: (307, 2)
The shape of X_val is: (307, 2)
The shape of y_val is:  (307,)
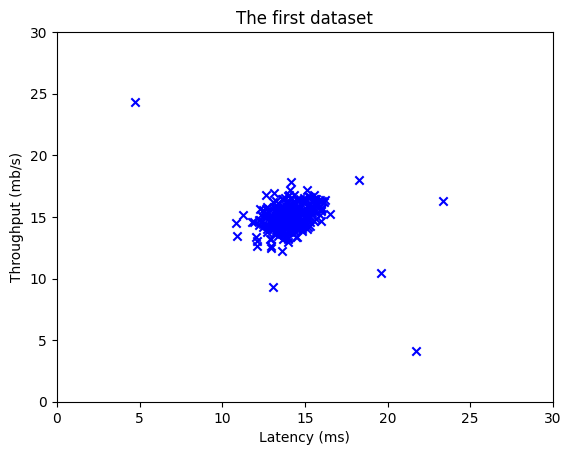
# Create a scatter plot of the data. To change the markers to blue "x",
# we used the 'marker' and 'c' parameters
plt.scatter(X_train[:, 0], X_train[:, 1], marker='x', c='b')

# Set the title
plt.title("The first dataset")
# Set the y-axis label
plt.ylabel('Throughput (mb/s)')
# Set the x-axis label
plt.xlabel('Latency (ms)')
# Set axis range
plt.axis([0, 30, 0, 30])
plt.show()
def estimate_gaussian(X):
    """
    Calculates mean and variance of all features
    in the dataset

    Args:
        X (ndarray): (m, n) Data matrix

    Returns:
        mu (ndarray): (n,) Mean of all features
        var (ndarray): (n,) Variance of all features
    """

    m, n = X.shape

    mu = 1 / m * np.sum(X, axis = 0)
    var = 1 / m * np.sum((X - mu) ** 2, axis = 0)


    return mu, var
# Estimate mean and variance of each feature
mu, var = estimate_gaussian(X_train)

print("Mean of each feature:", mu)
print("Variance of each feature:", var)
Mean of each feature: [14.11222578 14.99771051]
Variance of each feature: [1.83263141 1.70974533]
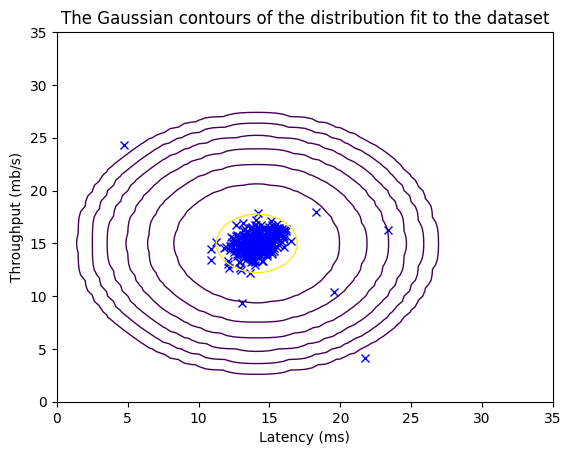
# Returns the density of the multivariate normal
# at each data point (row) of X_train
p = multivariate_gaussian(X_train, mu, var)

#Plotting code
visualize_fit(X_train, mu, var)
def select_threshold(y_val, p_val):
    """
    Finds the best threshold to use for selecting outliers
    based on the results from a validation set (p_val)
    and the ground truth (y_val)

    Args:
        y_val (ndarray): Ground truth on validation set
        p_val (ndarray): Results on validation set

    Returns:
        epsilon (float): Threshold chosen
        F1 (float):      F1 score by choosing epsilon as threshold
    """

    best_epsilon = 0
    best_F1 = 0
    F1 = 0

    step_size = (max(p_val) - min(p_val)) / 1000

    for epsilon in np.arange(min(p_val), max(p_val), step_size):

        predictions = (p_val < epsilon) # Predictions for each example using epsilon as threshold

        tp = np.sum((predictions == 1) & (y_val == 1)) # Number of true positives
        fp = np.sum((predictions == 1) & (y_val == 0)) # Number of false positives
        fn = np.sum((predictions == 0) & (y_val == 1)) # Number of false negatives

        prec = tp / (tp + fp) # Precision
        rec = tp / (tp + fn) # Recall

        F1 = 2 * prec * rec / (prec + rec)

        if F1 > best_F1:
            best_F1 = F1
            best_epsilon = epsilon

    return best_epsilon, best_F1
p_val = multivariate_gaussian(X_val, mu, var)
epsilon, F1 = select_threshold(y_val, p_val)

print('Best epsilon found using cross-validation: %e' % epsilon)
print('Best F1 on Cross Validation Set: %f' % F1)
Best epsilon found using cross-validation: 8.990853e-05
Best F1 on Cross Validation Set: 0.875000


C:\Users\HP\AppData\Local\Temp\ipykernel_13004\562433057.py:30: RuntimeWarning: invalid value encountered in long_scalars
  prec = tp / (tp + fp) # Precision
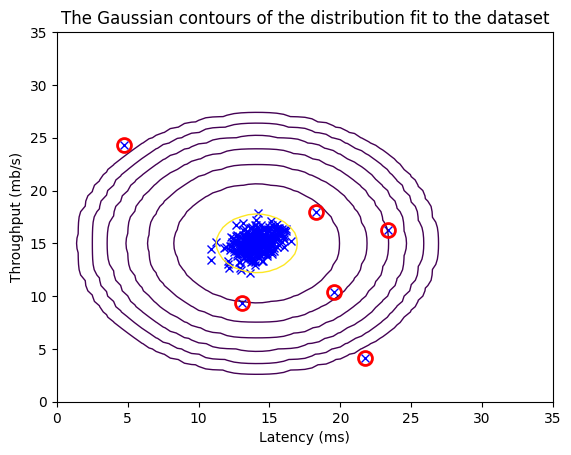
# Find the outliers in the training set
outliers = p < epsilon

# Visualize the fit
visualize_fit(X_train, mu, var)

# Draw a red circle around those outliers
plt.plot(X_train[outliers, 0], X_train[outliers, 1], 'ro',
         markersize= 10,markerfacecolor='none', markeredgewidth=2)
[<matplotlib.lines.Line2D at 0x2fa2342a580>]
High dimensional dataset
- The
load_data()function shown below loads the data into variablesX_train_high,X_val_highandy_val_high_highis meant to distinguish these variables from the ones used in the previous part- We will use
X_train_highto fit Gaussian distribution - We will use
X_val_highandy_val_highas a cross validation set to select a threshold and determine anomalous vs normal examples
# load the dataset
X_train_high, X_val_high, y_val_high = load_data_multi()
print ('The shape of X_train_high is:', X_train_high.shape)
print ('The shape of X_val_high is:', X_val_high.shape)
print ('The shape of y_val_high is: ', y_val_high.shape)
The shape of X_train_high is: (1000, 11)
The shape of X_val_high is: (100, 11)
The shape of y_val_high is:  (100,)
Anomaly detection
- Estimate the Gaussian parameters ($\mu_i$ and $\sigma_i^2$)
- Evaluate the probabilities for both the training data
X_train_highfrom which you estimated the Gaussian parameters, as well as for the the cross-validation setX_val_high. - Finally, it will use
select_thresholdto find the best threshold $\varepsilon$.
# Estimate the Gaussian parameters
mu_high, var_high = estimate_gaussian(X_train_high)

# Evaluate the probabilites for the training set
p_high = multivariate_gaussian(X_train_high, mu_high, var_high)

# Evaluate the probabilites for the cross validation set
p_val_high = multivariate_gaussian(X_val_high, mu_high, var_high)

# Find the best threshold
epsilon_high, F1_high = select_threshold(y_val_high, p_val_high)

print('Best epsilon found using cross-validation: %e'% epsilon_high)
print('Best F1 on Cross Validation Set:  %f'% F1_high)
print('# Anomalies found: %d'% sum(p_high < epsilon_high))
Best epsilon found using cross-validation: 1.377229e-18
Best F1 on Cross Validation Set:  0.615385
# Anomalies found: 117


C:\Users\HP\AppData\Local\Temp\ipykernel_13004\562433057.py:30: RuntimeWarning: invalid value encountered in long_scalars
  prec = tp / (tp + fp) # Precision